This article is part of a series of country-specific essays on the results of the European Union (EU) Farm structure survey (FSS) 2010. The FSS – also known as Survey on the structure of agricultural holdings – is carried out by all European Union Member States every 10 years (the full scope being the Agricultural census) with intermediate sample surveys being carried out three times between the basic surveys. The 2010 FSS was carried out in most of the European countries as an Agricultural Census. This analysis of the farm structure in Portugal includes a comparison with the previous (2000) Agricultural Census. Although in Portugal the reference years of the Agricultural Census were 1999 and 2009 respectively, the common designation is Agricultural census 2000 and 2010.
Since 2007 the Survey on agricultural productions methods (SAPM) is carried out together with FSS. In Portugal, the 2010 SAPM was carried out together with the Agricultural Census. Accordingly main statistical findings from SAPM are also included in this article.
Main statistical findings
Key Indicators
In 2009 there were 305.207 agricultural holdings in Portugal. Since 1999 the number of agricultural holdings decreased by 26.6 %, following the general pattern of the European agriculture. This means that during this decade one in every four farms ceased its activity.
The utilised agricultural area (UAA) represents 40 % of the Portuguese territory; a decrease of 5 % is reported in comparison to 1999. Positive developments were observed for the average area of the holdings, which increased from 9 to 12 ha, this is the direct effect of the bigger holdings absorbing the area of the smaller ones that are closing down. Currently, in Portugal, half of the agricultural holdings have less than 2 ha of UAA, whereas the farms with 50 ha or more of UAA represent more than the 66 % of the total UAA and the 3 % of all farms.
When looking at the animal livestock expressed in livestock unit (LSU), it can be observed that in 2009 2.2 million LSU were recorded in Portugal. This represents a decrease of 0.3 million LSU (-14 %) when compared to 1999.
Between 1999 and 2009, the number of persons working in agriculture dropped by one third (from 1 million to 0.7 million). However, the active population in agriculture still represents 12.7 % of the economically active population of Portugal.
According to the latest structural agricultural data available, on average in Portugal there are 0.35 hectares of UAA per inhabitant: the equivalent of an area of 60 square metres. This figure represents a slight decrease since the previous Agricultural census, when the UAA per inhabitant was 0.38 hectares.
Regional Key Indicator
When comparing 1999 with 2009 data, the variation in the structure of the farms appears significantly different throughout the various regions of Portugal. The "Alentejo" region – which represents almost the 60 % of the UAA and the 37 % of the LSU of the whole country – shows signs of increase in terms of agricultural activity. Although the number of farms has decreased by 17 % in this region, the UAA has increased slight (0.4 %) and the LSU has done even more so (6 %). In terms of number of holdings, the highest decrease is in the region "Lisboa", where the variation in the number of farms is -38 %, followed by the regions "Algarve" and "Centro" (-35 %).
Agricultural holdings
Analysing the agricultural holdings by size, the tendency of the small ones to disappear in favour of the bigger holdings is confirmed. According to 2009 data, over the last ten years the number of holdings with less than 2 ha dropped from 223.720 to 152.460 (-28 %), whereas the number of holdings with more than 50 ha increased from 9.910 to 10.470.
Economic size of the farm
In 2009, the economic size of the all Portuguese agricultural holdings is 305.270 Euro, a value calculated by adding all the standard output (SO) per hectare of crop and head of livestock of the farms. When compared to data from the 2007 FSS, a slight increase is observed. The increase comes mainly from the small holdings, with an average monetary value of less than 2000 euro per year. In 2009 these agricultural holdings accounted for 38 % of the total standard output. The agricultural holdings with an average size between 2000 and 4000 registered an increase of around 24 %. In terms of representativeness, in 2009 these two types of holdings account for almost 62 % of the total standard output. Here no changes where observed compared to FSS 2007.
Agricultural holding by main type of farming
With the exception of farms combining various crops and livestock (14.7 %), holdings specialised in vineyards are the most common in Portugal. According to the last Agricultural census they represent around 12 % of the total number of holdings while the mixed cropping farms account for 10.3 %.The holdings specialised in olive production represent 8.5 % of the total, a share slightly smaller than the one of farms focused on special fruits and citrus fruits (8.8 %).
In terms of business volumes things look different. Indeed, when using the SO for measuring main type of farming the holdings specialised in dairying have the biggest share (16.4 %), followed by those dedicated to cattle-rearing and fattening (9.5 %). Farms involved in general field cropping account for the 8.7 % of the total volume of SO, while those specialised in poultry account for the 7.7 %, the same share as the farms specialised in fruits and citrus fruits production.
Land use
Permanent grassland and meadows has gained importance in the total agricultural area, in 2009 it covered almost half of the Portuguese UAA. This area comes mostly from the arable land which has decreased by 33 % since 1999. In the EU, the adoption of the Single payment scheme (SPS) introduced by the Common agricultural policy (CAP) after 2005 decoupled the payments from agricultural products to agricultural production, supporting the change from arable land to permanent grassland and meadows.
Maintenance of the ratio of the land under permanent pasture in relation to the total agricultural area was one of the components of the Good agricultural and environmental conditions (GAEC) that was imposed by the SPS. In addition to this, increase of input costs faced by the farmers (fuel and fertilisers) has not been compensated by the price of the farm products. Maintenance of the land with less production, while still receiving financial support, was considered a better option for farmers.
Arable land
In Portugal the total arable area decreased by 33 % from 1999 to 2009, this value represents around 15 % of the whole 2009 UAA. The reduction was due to the fall in the area of cereals which recorded a large drop (-42 %): 244.000 ha less if compared to the 1999 cereal area. With the exception of barley and rice, all the other areas of cereal dropped when compared with previous Agricultural Census data. In particular, the area of durum wheat dropped by 85 %, from 74.000 ha to 11.000 ha in 2009. Moreover, the decrease in the area of industrial crops (-66 %) and potatoes (-60 %) contributed to the overall decrease of the arable land, as did the reduction of the area of fallow land (-39 %).
Permanent crops
Permanent grassland
The area of permanent grassland has increased 28 % from 1999 to 2009 in Portugal. The maintanance of the permanent grassland is recognised as being beneficial to the environment, as opposed to massive conversion to arable land. The CAP intended to maintain the existing ratio of permanent grassland/UAA.In tha case of Portugal, the effect was that permanent grassland even replaced some of the arable land.
Three different types of permanent grassland are identified in the FSS. The permanent pasture usally used for intensive grazing, the rough(extensive) grazing with a low density of livestock, and also the permanent grassland not used for production but for keeping land in GAEC. In Portugal 25 % of the permanent grassland is intensive grazing, 74 % is rough grazing and less than 1 % is used for keeping land in GAEC.
This distribution varies amongst the different regions. the Two extreme examples are Alentejo (19 % of intensive grazing and 80% of rough grazing) and Azores (85 % of intensive grazing and 15 % of rough grazing).
Permanent crops
The permanent crops in Portugal are 19 % of the UAA. The typical Mediterranean olives trees (9 % of the UAA) and vineyards (5%) are the main permanent crops in Portugal. The area of permanent crops has had a 3 % decrease from 1999 to 2009. But some crops decreased in area, while others have an increase in area:
Irrigation
Irrigated area fell by 23 %; TO BE COMPLETED (...)
Mention that irrigated areas do not include kitchen gardens or areas under protective cover (these latter areas are in principal always irrigated). Mention that this is always relatied to the weather conditions of the surveyed year.
Livestock
TO BE COMPLETED (...)
Some ideas: Tables- Right side- NUTS 0 – LSU , heads and hold by type of Livestock Link to Same table NUTS2 LSU per inhabitant NUTS = and link to NUTS 2.
Statistics on livestock use two different units of measurement the number of heads (number of animals) and also the livestock unit that makes the comparison between different livestock possible.
The bovine livestock in Portugal make up for XX % of the total livestock.
The average number of LSU per holding doubled in the case of holdings with pigs and cattle.
Labour force
TO BE COMPLETED (...)
Some ideas: From the Portuguese publication:
The family labour force lost 443 mil persons.
Women are 1/3 of the holders and their percentage has increased by 8 percentual points. (check to see what year is used for comparison).
The average age of producers has increased 4 years. (check to see what year is used for comparison).
Check to see the percentage of the persons working in agriculture in the total active population.
Farms' economic size and farm type
TO BE COMPLETED (...)
Data sources and availability
Survey on agricultural production methods (SAPM)
The Survey on agricultural production methods (SAPM) was carried out along with the Agricultural census.
TO BE COMPLETED (...) Some ideas taken from the Portuguese publication: Irrigated area fell by 23%; The number of tractors increased 10%;
Methodological notes Portugal – Agricultural census 2009
The Agricultural census 2009 was the third agricultural census to be carried out in Portugal harmonised with the European legislation. The other editions of the Census were in 1989 and 1999. The Farm structure survey (FSS) was also held in 1992, 1995, 1997, 2003, 2005 and 2007; these intermediate surveys were sample surveys. The Portuguese Statistical Institute (INE) in coordination with its regional agencies implemented the FSS 2009 in Portugal.
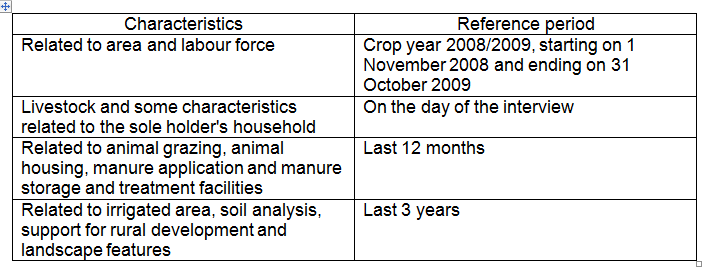
Reference period
The data were collected from November 2009 to October 2010 which involved around 2000 technical staff. Different reference periods were used depending on the characteristics being surveyed.
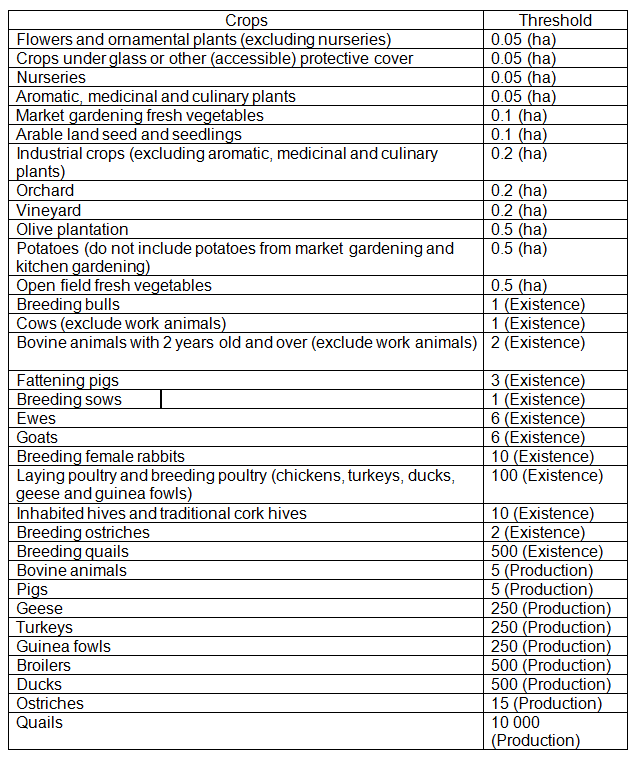
Thresholds for agricultural holdings
The Portuguese definition of an agricultural holding is the reflection of the EU definition: a technical and economic unit which used its own labour and production factors and produces agricultural products (or maintains land in good agricultural and environmental conditions), has a single management, is located in an identifiable place and reaches the following threshold:
- mainland - at least 1 ha of utilised agricultural area (UAA);
- islands - at least 0.1 ha of utilised agricultural area (UAA);
- Other thresholds were also applied and took into account the production of the holding.
For the characteristics of animal housing of the Survey on agricultural productions methods (SAPM) the thresholds were the following:
- bovine animals - 10 heads;
- all pigs - 50 heads;
- breeding sows - 10 heads;
- all poultry - 1000 heads.
Common land
In Portugal the area of common land was surveyed as a “common land agricultural holding”. The information on common land was collected from the managing entities by interview. Data was also crosschecked with data available in administrative sources.
Geo-reference of the holding
The georeferencing of the holdings was done by using the geographical coordinates of the centriods (the centre point) of the communes (the lowest administrative units).
Volume of irrigation water
This characteristic was calculated using estimation models based on the soil-water balance. The factors taken into account include: efficiency of irrigation systems, legal personality of the holding, age, educational level and agricultural training of the manager.
This model did not include the irrigated area of kitchen gardens (which in 2010 represent only 0.2% of the total UAA).
Other methodological issues
Variables “Support for rural development – Meeting standards based on Community legislation” and “Support for rural development – Natura 2000 payments for agricultural area” were not collected because the measures were not implemented in the established reference period.
Comparison with the FSS 2007
When comparing the results of the census 1999 with the census 2009 the values for the key variables of the structure of the agricultural holding have a clear tendency to decrease (number of holdings, utilised agricultural area, livestock and labour force). When comparing the same variables of the FSS 2007 and census 2009 there is a general increase. The increase in this 2 year period can be explained by the fact that these two surveys were carried out using quite different methodologies.
For the FSS sample Survey in 2007 the sample base was the register created from the 1999 General Agricultural Census. The time gap between the creation of the sample base and its use for the 2007 sampling undermined to some extent the output of the 2007 results. In addition, the sample surveys carried out in 2003, 2005 and 2007 were based on the same panel of holdings, as to obtain information on the structure of the holdings and evaluate their development. As result of this sampling methodology, it is possible that the developments in the general population of the holdings was not completely reflected in the panel of holdings and ultimately in the survey output.
The National Methodological Report for the Portuguese Agricultural Census 2009 is available here.
Context
European Commission Rural development policy aims to improve competitiveness in agriculture and forestry, improve the environment and countryside, improve the quality of life in rural areas and encourage the diversification of rural economies.
As agriculture has modernised and the importance of industry and services within the economy has increased, so agriculture has become much less important as a source of jobs. Consequently, increasing emphasis is placed on the role farmers can play in rural development, including forestry, biodiversity, the diversification of the rural economy to create alternative jobs and environmental protection in rural areas.
The FSS continues to adapt to provide timely and relevant data to help analyse and follow these developments.
Further Eurostat information
Publications
- Farm Structure Survey in Portugal - 2007 - Statistics in focus 22/2009
- Methodological Report – FSS 2007 Portugal
Main tables
- Agriculture, see:
- Structure of agricultural holdings (t_ef)
Database
- Agriculture, see:
- Structure of agricultural holdings (ef)
Dedicated section
Methodology / Metadata
- Structure of agricultural holdings (ESMS metadata file - ef_esms)
See also
External links
[[Category:<Agriculture>|Agricultural census in Portugal]] [[Category:<Statistical article>|Agricultural census in Portugal]]