No higher resolution available.
FSS-average-UAA-per-holding-by-country-2007.png (710 × 497 pixels, file size: 35 KB, MIME type: image/png )
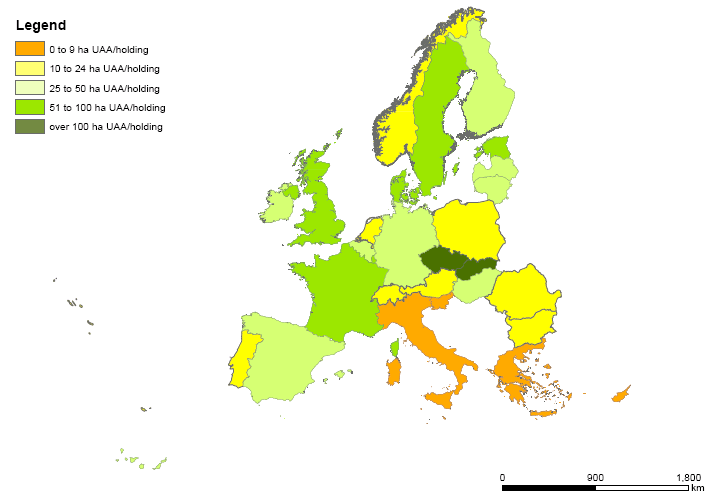
Average UAA per holding by country, 2007
Graph Map Table created with data from April 2010
Most recent data available now, see:
Key variables by size of farm (UAA), economic size of farm (ESU) and LFA status (ef_ov_kvaaesu)
Key variables by size of farm (UAA), economic size of farm (ESU) and LFA status (ef_ov_kvaaesu)
File usage
There are no pages that use this file.