No higher resolution available.
Migration_per_1000_inhabitants_2008.png (792 × 434 pixels, file size: 5 KB, MIME type: image/png )
Title of graph, map or table, including last reference period
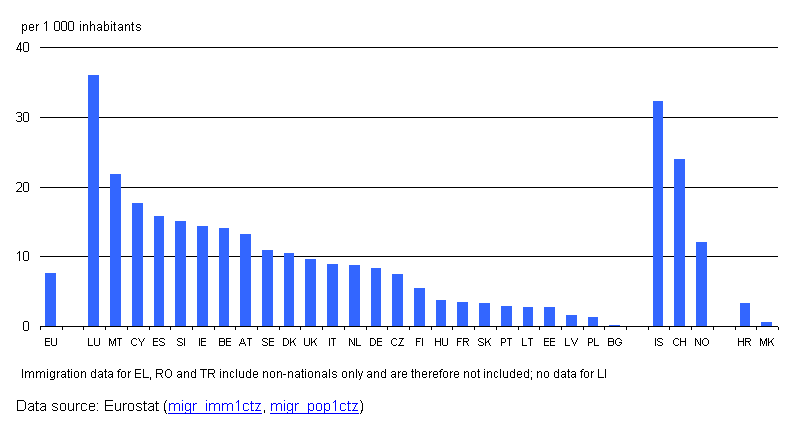
Migration flows per thousand inhabitants, 2008
Graph Map Table created with data from Month Year
Octiber 2010
Most recent data available now, see:
Immigration by sex, age group and citizenship (MIGR_IMM1CTZ)
File usage
There are no pages that use this file.