Data from April 2021.
Planned update of the article: May 2022.
Highlights
In 2020, the employment rate in the EU has dropped for the first time since 2013 due to the impact of COVID-19 measures on the labour market: it stands at 72.9 % for persons aged 20-64
The gender employment gap has shrunken from 11.7 to 11.3 percentage points between 2019 and 2020, notwithstanding Covid-19 measures.
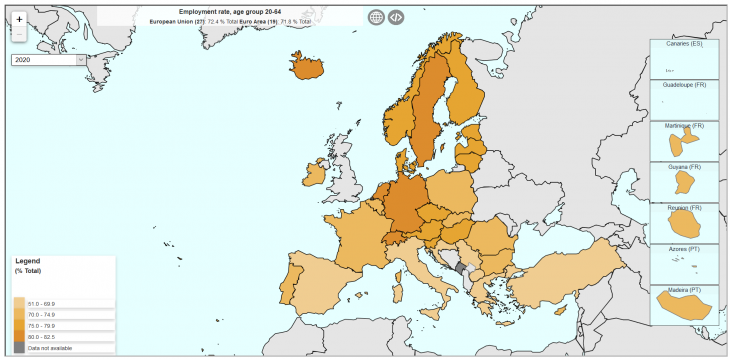 Map 1: Employment rates persons 20-64 in 2020, %
Click on the map for an interactive view of the data.
This article provides insight in the progression towards higher employment in the EU and the Member States. In 2019 the EU-27 had the highest employment rate since the beginning of the series in 2002 and has experienced a drop in 2020 solely due to the Covid-10 measures that had an unprecedented and direct impact on the labour market. A decrease in the unemployment rate was consequently observed in all but three of the EU Member States. The gender employment gap has nevertheless continued its significant decrease, and stood at 11.3 pp in comparison to 11.7 in 2019. Persons aged 55-64 have overall been less affected by the measures, and experienced an increase in the employment rate from 59.2 % in 2019 to 59.6 % in 2020.
The employment rate gives information on the share of the population of a certain age group who have a paid job (in other words, of the employed persons). They can be paid in cash or in kind and the person can have a job as an employee, as a self-employed person or as a family worker. In most cases, a paid job is an important indicator of the living standard of people and the employment rate mainly determines the socio-economic conditions of individuals in a country. Moreover, it provides key macroeconomic information as it describes to what extent human resources of a country are mobilized for economic purposes.
Persistent increase of the employment rate at EU level has
In 2020, the employment rate of persons aged 20-64 in the EU dropped to 73.1 %. This was the highest rate recorded since 2008 (starting reference year for the employment area of the Europe 2020 strategy). Just more than one decade before, in 2008, the financial crisis took place. In that year the employment rate was 69.5 %, with on average a drop in rate the following years until 2013 (Figure 1).
The employment rate has grown overall by 3.6 percentage points (p.p.) since 2008 and 5.6 p.p. since 2013. Between 2014 and 2018, there was a persistent year-on-year growth of at least 1 p.p. The employment rate increase between 2018 and 2019 was a bit smaller (+ 0.7 p.p.). In 2019, the EU was 1.9 p.p. away from its 75 % employment target.
.png)
EU Member States compared
As shown on Map 1, there are notable differences in employment rate across EU Member States. In 2019, there was a difference of 20.9 p.p. between the country with the highest and the country with the lowest employment rate; Sweden is at the top end with 82.1 % while Greece is at the bottom end with 61.2 %. Between these two extremes, four major groups of countries can be distinguished: one with employment rates lower than 69.9 %, one with rates ranging from 70.0 to 74.9 %, one with rates within the range of 75.0 to 79.9 % and one with rates of 80.0 % or above. Italy, Croatia and Spain are part of the first group, while the second group consists of Belgium, Romania, France, Luxembourg, Poland and Slovakia. The third group is the biggest one and is made out of Bulgaria, Ireland, Hungary, Cyprus, Portugal, Slovenia, Austria, Malta, Finland, Latvia, Lithuania and Denmark. The last group, with the highest employment rates, contains the remaining EU Member States, i.e. the Netherlands, Estonia, Czechia and Germany.
Gender employment gap shrinking, but still sizeable
The gender gap in employment, as well as the employment rate of men and women, in each country is shown for 2008 and 2019 in Figure 2. Countries are ranked based on the size of the gender employment gap in 2019. The longer the line, the bigger the gender gap.
For EU, the gender employment gap has diminished in 2019 compared with 2008: from 15.3 to 11.7 p.p. This decrease at EU-level is the result of the increase of women's employment rate. During the last decade, the employment rate for men has practically remained unchanged and stabilized.
.png)
In 2019 compared with 2008, the majority of the Member States show a decrease in the gender employment gap; only Romania and Hungary show an increase in the gap between sexes. Moreover, over the same period of time, the greater part of the Member States show increased rates for both sexes, with some exceptions. Greece shows a drop in employment rate for both men and women, while Italy, Spain, Cyprus, Croatia, Belgium and Denmark display increased employment rates for women, but decreased employment rates for men. On the other hand, in Ireland, Luxembourg, France and Latvia the employment rate for men was stable in 2008 compared to 2019, while women's employment rate has increased.
Overall, the decreasing gender gaps in employment across countries can consequently be explained by the following two factors: (i) in one half of the EU Member States, this is due to the growing employment rate of both men and women, with a faster increase among women than among men, and (ii) in the other half of the countries, this is due to decreasing employment rates among men, with at the same time increasing rates among women.
More persons aged 55-64 in employment
The European Union has, in addition to the goal to increase the employment rate among women, the policy target to increase the employment rate of the senior population.
The change in employment rate from 2008 to 2019 largely depends on the age for both sexes (Figure 3): among senior men and women aged 55-64, the employment rate increased by + 13.1 and + 17.8 p.p.; among the young people aged 15-24 it decreased by - 2.3 and - 0.7 p.p. respectively. Interestingly, for middle aged men (aged 25-54) the employment rate has decreased by - 0.3 p.p., while it increased for women in the same age group (+ 3.2 p.p.).
Comparing the employment rate of 2019 with the Europe 2020 target at EU level, only the group of middle aged men (aged 25-54) shows an employment rate above the 75 % EU target. The highest employment rate for this group is recorded in 2008 (86.7 %). For middle aged women the opposite is shown: since 2013 there is a gradual and steady increase in employment rate with the highest rate recorded in 2019, i.e. 74.8 % which is just - 0.2 p.p. away from the EU 2020 target.
.png)
EU Member States compared
<datadetails>
Data sources
Source: The European Union Labour Force Survey (EU-LFS) is the largest European household sample survey providing quarterly and annual results on labour participation of people aged 15 and over as well as on persons outside the labour force. It covers residents in private households. Conscripts in military or community service are not included in the results.
Reference period: Yearly results are obtained as averages of the four quarters in the year.
Coverage: The results from the survey currently cover all European Union Member States, the United Kingdom, the EFTA Member States of Iceland, Norway, Switzerland, as well as the candidate countries Montenegro, North Macedonia, Serbia and Turkey. For Cyprus, the survey covers only the areas of Cyprus controlled by the Government of the Republic of Cyprus.
European aggregates: EU refers to the sum of EU-27 Member States. If data are unavailable for a country, the calculation of the corresponding aggregates takes into account the data for the same country for the most recent period available. Such cases are indicated.
Definitions: The concepts and definitions used in the survey follow the guidelines of the International Labour Organisation. Employment covers persons aged 15 years and over (16 and over in Spain and Italy, 15-74 years in Estonia, Latvia, Hungary, Finland, Sweden, Norway and Denmark, and 16-74 years in Iceland), living in private households, who during the reference week performed work, even for just one hour, for pay, profit or family gain, or were not at work but had a job or business from which they were temporarily absent, for example because of illness, holidays, industrial dispute or education and training.
The LFS employment concept differs from national accounts domestic employment, as the latter sets no limit on age or type of household, and also includes the non-resident population contributing to GDP and conscripts in military or community service.
The EU-LFS is based on the same target populations and uses the same definitions in all countries, which means that the results are comparable between the countries.
Five different articles on detailed technical and methodological information is linked from the overview page EU labour force survey.
Please note that Eurostat provides two sets of indicators linked to the annual employment rate, which serve different purposes and which in some cases differ from each other:
1) The main indicators, which are seasonally adjusted. They include the headline indicators under the EU2020 Strategy and are consequently used for monitoring the EU 2020 targets (at EU and national levels). They have only a few breakdowns and normally refer to the age group 20-64. Please note that for France, two series are published: one including overseas departments starting in 2003, and one for metropolitan France, excluding overseas departments, starting in 1992. The latter is evaluated in the EU2020 strategy, and also included in the relevant EU and EA aggregates.
2) The detailed results, which are not seasonally adjusted. They have a large number of breakdowns and can therefore be used for more detailed analysis. For France, only one data series is published. This series contains data for metropolitan France until the fourth quarter of 2013, and from 2014 on, also the French overseas departments.
This article presents annual results for some indicators from the "main indicators" set. </datadetails>
<context>
Context
Employment statistics are at the heart of many EU policies. The European employment strategy (EES) was launched at the Luxembourg jobs summit in November 1997 and was revamped in 2005 to align the EU’s employment strategy more closely to a set of revised Lisbon objectives, and in July 2008, employment policy guidelines for the period 2008–2010 were updated. More recently, the European Pillar of Social Rights has been jointly signed by the European Parliament, the Council and the Commission on 17 November 2017. Employment and social policies are the main fields of interest of the European Pillar of Social Rights, which is about delivering new and more effective rights for citizens. It has 3 main categories: (1) Equal opportunities and access to the labour market, (2) Fair working conditions and (3) Social protection and inclusion. In particular, today's more flexible working arrangements provide new job opportunities especially for the young but can potentially give rise to new precariousness and inequalities. Building a fairer Europe and strengthening its social dimension is a key priority for the Commission. The European Pillar of Social Rights is accompanied by a ‘social scoreboard’ which monitors the implementation of the Pillar by tracking trends and performances across EU countries in 12 areas and feeds into the European Semester of economic policy coordination. The scoreboard also serves to assess progress towards a social ‘triple A’ for the EU as a whole.
The EU-LFS is an important source of information about the situation and trends in the national and EU labour markets. Each quarter around 1.8 million interviews are conducted throughout the participating countries to obtain statistical information for some 100 variables. Due to the diversity of information and the large sample size, the EU-LFS is also an important source for other European statistics like Education statistics or Regional statistics. </context> <seealso>
</seealso>
<publications>
</publications>
<maintables>
</maintables>
<database>
</database>
<dedicatedsection>
</dedicatedsection>
<methodology>
</methodology>