Make cities and human settlements inclusive, safe, resilient and sustainable
Data extracted in April 2025.
Planned article update: June 2026.
Highlights

This article is a part of a set of statistical articles, which are based on the Eurostat publication ’Sustainable development in the European Union — Monitoring report on progress towards the SDGs in an EU context — 2025 edition’. This report is the ninth edition of Eurostat’s series of monitoring reports on sustainable development, which provide a quantitative assessment of progress of the EU towards the SDGs in an EU context.
SDG 11 aims to renew and plan cities and other human settlements in a way that offers opportunities for all, with access to basic services, energy, housing, transport, waste management, clean air and green public spaces, while reducing resource use and environmental impact.
Sustainable cities and communities in the EU: overview and key trends
Almost three-quarters of the EU population live in urban areas — cities, towns and suburbs — with about 39% residing in cities alone [1]. With the share of Europe’s urban population projected to rise to just over 80% by 2050 [2], cities, towns and suburbs will need to become more sustainable in order for the 2030 Agenda to be achieved. Monitoring SDG 11 in an EU context means looking at developments in the quality of life in cities and communities, sustainable mobility and adverse environmental impacts. Overall, the EU has made moderate progress towards SDG 11 over the past five-year period assessed. While there has been strong progress towards increasing the quality of life in cities and communities, trends in sustainable mobility are rather unfavourable. The picture is diverse when it comes to impacts on the environment, where both sustainable and unsustainable developments have been observed.

Table 1: Indicators measuring progress towards SDG 11, EU
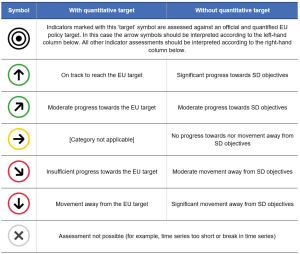
Table 2: Explanation of symbols for indicating progress towards SD objectives and targets


Quality of life in cities and communities
While European cities and communities provide opportunities for employment and other economic and cultural activities, many inhabitants still face considerable social challenges and inequalities. Problems affecting the quality of housing and the wider residential area, such as noise disturbance, crime and vandalism, are some of the most visible challenges that cities and communities can face and which impact quality of life.
Quality of housing in the EU has been improving since 2010
Safe and adequate homes are a foundation for living an independent, healthy and fulfilling life. Poor housing conditions, on the other hand, are associated with lower life chances, health inequalities, increased risks of poverty and environmental hazards.
The severe housing deprivation rate refers to the share of the total population living in an overcrowded household while also experiencing types of housing deprivation such as a leaking roof, damp walls, floors or foundations; rot in window frames or floors; lack of sanitary facilities; or a dwelling that is considered too dark. Between 2010 and 2023, the share of EU residents who lived in such conditions fell by 2.1 percentage points, which indicates a significant improvement in the perceived quality of the EU’s housing stock. In 2023, 4.0% of the EU population faced severe housing deprivation in 2023, compared with 6.1% in 2010 and 4.3% in 2018.
Perceived safety in residential areas has continued to improve, but noise disturbance levels have stagnated
Noise disturbance can cause annoyance, stress, sleep deprivation, poor mental health and well-being, as well as harm to the cardiovascular and metabolic system [3]. Likewise, crime and vandalism can also reduce quality of life and housing satisfaction in a residential area. In 2023, 18.2% of the EU population (close to 82 million people) said their household suffered from noise disturbance [4]. While this constitutes a long-term improvement of 2.4 percentage points since 2010, the rate has been stagnating since 2018, with no improvement nor worsening of the situation. At the same time, 10.0% of the EU population perceived there had been crime, violence and vandalism in their neighbourhoods in 2023, showing an improvement from 13.1% in 2010. This trend has been steadily improving since its peak of 14.1% in 2013.
The EU’s zero pollution action plan aims to reduce the share of people chronically disturbed by transport noise by 30% by 2030 compared with 2017. At 55 decibels (dB) noise levels can start to have critical effects, ranging from severe annoyance and sleep disturbance to hearing impairment [5]. The more recent WHO guidelines for Europe are even more stringent, recommending that the noise level from road traffic should be below 53 dB during the day and below 45 dB at night. While railways and airports represent further significant sources of local noise pollution, their impact on the overall population is much lower. According to European Environment Agency (EEA) estimates on the exposure of Europe’s population to environmental noise, over 20% of the European population is exposed to long-term unhealthy noise levels from transportation sources. This figure increases to 30% when considering the more stringent WHO regulations. According to the Zero pollution monitoring and outlook 2025, reducing the number of people chronically disturbed by transport noise by 30% until 2030 is unlikely, with the most optimistic scenario only estimating a 23% reduction by 2030, while a reduction of only 2% would be achieved under a conservative scenario.
Exposure to fine particulate matter leads to premature deaths and lost years of life, but improvements are visible in the EU
Pollutants such as fine particulate matter (PM2.5) suspended in the air reduce people’s life expectancy, and can lead to or aggravate many chronic and acute respiratory and cardiovascular diseases [6]. Exposure to air pollution is of particular concern in cities because the concentration of economic activities and high population densities mean there are many potential emission sources and a large number of people are affected.
According to data from the European Environment Agency (EEA), three EU Member States (Croatia, Greece and Italy) recorded PM2.5 concentrations above the EU annual limit value of 25 micrograms per cubic metre (μg/m3) [7] in 2023. The higher PM2.5 concentrations in central and eastern Europe are mainly due to solid fuel use and an older vehicle fleet [8]. However, when considering the more stringent WHO air quality guideline of 5 μg/m3, all EU Member States reported concentration levels that exceeded the limit. Additionally, EEA estimates suggest that most of the EU’s population was exposed to key air pollutants above the WHO guideline levels, especially in urban areas. Almost all EU city dwellers (94%) were exposed to PM2.5 concentrations above the WHO guideline level of 5 μg/m3 in 2023.
In the EU, long-term exposure to fine particulate matter was responsible for around 239 000 premature deaths in 2022. This number represents a 44.6% reduction since 2005, meaning the EU appears to be on track to meet the zero pollution action plan target for 2030. This aims to reduce the number of premature deaths due to fine particulate matter exposure by more than 55% compared with 2005. According to an EEA analysis, if the long-term trend observed over the past 17 years were to continue, the EU would achieve a 63% decline in this number, thereby overachieving the EU’s 2030 target.
Urban residents remain the group most affected by noise pollution and crime in the EU
Statistics on the degree of urbanisation provide an analytical and descriptive lens through which to view urban and rural communities. Eurostat differentiates between three types of area — ‘cities’, ‘towns and suburbs’ and ‘rural areas’ [9] — based on the share of the local population living in urban centres and clusters.
In 2023, the perceived occurrence of crime and vandalism in cities (19.0%) was almost three times higher than in rural areas (5.9%) and above the level observed in towns and suburbs (10.1%) [10]. The perceived level of noise pollution also varies greatly depending on the degree of urbanisation. People living in EU cities were more likely to report noise from neighbours or from the street (24.3%) compared with those living in towns and suburbs (16.9%) or in rural areas (10.5%) [11]. People living in cities also faced more issues with their dwelling, with a severe housing deprivation rate of 4.9%, compared with rural areas (3.5%) and towns and suburbs (3.3%) [12].
Access to green spaces makes urban residents more satisfied with their city
Green spaces in cities have a great potential to boost human health and well-being, and play a crucial role for children, the elderly and those with lower incomes, who may otherwise have limited access to nature. Universal accessibility to green spaces that are safe, inclusive and open is therefore essential. According to the survey on quality of life in European cities in 2023, around 76% of European urban residents were satisfied with the green spaces available within their city. This satisfaction rate was lower for those living in capital cities (73%) compared with non-capital cities (78%). Overall, Geneva, Malmö, Oslo and Munich received the highest scores from their residents, with more than 90% of the people surveyed in these cities stating satisfaction with their green spaces. Four of the top 10 cities with the highest satisfaction rates in Europe lie in the Scandinavian region. Among the Member States, southern countries showed lower than average satisfaction with green spaces, with rates below 60%. Overall, urban residents in Europe with greater access to green spaces tend to be more satisfied with the cities they live in. This was especially noted for retired residents, where access to green urban areas within a 400-metres walk was associated with lower levels of loneliness.
Sustainable mobility
A functioning transport system is necessary for people to reach their places of work, education, services and social activities, all of which affect quality of life and equal opportunities for everyone. In addition to availability, accessibility, quality and safety of transport systems are also crucial when designing sustainable and inclusive cities and communities.
Use of public transport modes improved in 2022 but remained below the pre-pandemic level
The EU aims to improve citizens’ quality of life and strengthen the economy by promoting sustainable urban mobility and greater use of clean and energy-efficient vehicles, together with reducing the demand for individual car transport. Public transport networks help to relieve traffic jams, reduce harmful pollution and offer more affordable and sustainable ways to commute to work, access services and travel for leisure.
Since 2000, the share of buses and trains in inland passenger transport has stagnated well below 20%, accounting for only 16.6% of passenger-kilometres (pkm) in 2022. The onset of the pandemic in 2020 drastically hit this sector, with its share falling by 4.5 percentage points compared with 2019, to 13.0%. The precautionary measures put in place, including domestic and international travel restrictions, quarantine restrictions, introduction of remote-working policies and changing mobility habits had led to a reduction in the use of public transport [13] and passengers’ perceptions about safety and comfort. The increase in the share of buses and trains in inland passenger transport in 2022 by 3.6 percentage points relative to 2020, represents a partial recovery since the pandemic. Nonetheless, the shares of public modes of mobility remain below pre-pandemic levels.
The figures presented above do not include tram and metro systems, which are common transport modes in — especially larger — cities. According to the 2023 survey on the quality of life in European cities, an average of 43% of respondents used public transport on a typical day, with this figure increasing as city size grows. Overall, the survey reveals that 73% of city residents in the EU are satisfied with public transport in their cities. Furthermore, around 83% of respondents consider their city's public transport to be safe and accessible, 74% view it as frequent, 72% find it reliable and around 70% regard it as affordable.
Walking, cycling and other active modes of transport are low-cost and emission-free, while offering health benefits associated with an active lifestyle. The survey shows that in 2023, 27% of people walked on a typical day in the city where they live. Between 2019 and 2023, the percentage of people walking increased by 15% (or 3 percentage points). This shift may reflect changes in preferences due to social distancing during the COVID-19 pandemic or the rising energy costs of other modes of transport.
According to the survey, 48% of city residents used cars, but this percentage declined as city size increased. Nonetheless, cars continue to remain the dominant form of passenger mobility [14] in the EU, accounting for 83.4% of passenger-kilometres travelled in the EU in 2022. However, this represents a 3.6 percentage point decrease compared with the pandemic values from 2020, signalling a potential return to pre-pandemic levels [15].
Deaths from road crashes have stagnated in recent years, and stronger progress is needed to meet the 2030 target
Road traffic injuries are a public health issue and have a huge economic cost. About 100 000 people are estimated to be seriously injured in road accidents in the EU each year [16]. In 2023, about 56 people a day lost their lives on EU roads. This corresponds to about 20 400 people for the entire year — a loss equivalent to the size of a medium town. Nevertheless, the EU has made progress in this respect compared with 2008, when road deaths amounted to almost 37 000. In recent years, however, the figures have experienced some fluctuations, in part explained by significant changes in traffic volumes as a result of the COVID-19 pandemic. After the pandemic-related low in 2020, road traffic deaths have more or less stagnated at around 20 000 deaths each year. Compared with the reference year 2019, road deaths had fallen by 10.4% by 2023, meaning the EU is still far from its 2030 target of halving the total death toll on EU roads relative to 2019. The most recent preliminary figures show that road fatalities fell to 19 800 deaths in 2024, a 3% improvement compared with 2023. Despite this positive step, the overall pace of improvement remains too slow.
The highest share of road-traffic fatalities in 2023 was recorded on rural roads (50%), followed by roads inside urban areas (36%) and motorways (8%) [17]. Most of the fatalities on rural roads involve car occupants, light goods vehicles and motorcyclists, while most of the fatalities in urban areas involve vulnerable road users such as pedestrians, cyclists and mopeds [18]. Data by age group show that younger people aged 18 to 24 and older people aged 65 or over have the highest rates of road fatalities, with 66 and 61 deaths per million inhabitants in 2023, respectively [19]. In both age groups, men had considerably higher road fatality rates than women. Data by transport mode show that over the period 2019 to 2023, the reduction in road fatalities was strongest for pedestrians and mopeds, by 20%, while fatalities for cyclists and motorcyclists only fell by 4% and 2%, respectively [20]. According to the European Road Safety Observatory’s thematic report on alcohol and drugs, around 25% of all road deaths in the EU are alcohol related. It is also estimated that 1.5% to 2% of the kilometres driven in the EU are done by drivers with an illegal blood alcohol content.
Impacts on the environment
While cities, towns and suburbs are a focal point for social and economic activity, if not managed sustainably, they risk causing considerable environmental damage. At the same time, large and densely populated cities provide opportunities for effective environmental action, indicating that urbanisation is not necessarily a threat but can act as a transformative force for more sustainable societies [21]. EU progress in reducing the environmental impacts of cities and communities is monitored by three indicators on the management of municipal waste, wastewater treatment and artificial land cover.
Soil sealing is increasing slowly but constantly in the EU
Offering numerous cultural, educational and job opportunities, an urban lifestyle is attractive to many people. However, growth in the urban population has also come with increased land take. Land take is described as the process of transforming agricultural, forest and other semi-natural and natural areas into artificial areas. Between 2012 and 2018, the net land take in cities and their commuting zones, also known as functional urban areas, amounted to 450 square kilometres (km2) annually. Additionally, most of the net land take (about 78%) happened in commuting areas [22].
Soil sealing is the most intense form of land take and is essentially an irreversible process. It destroys or covers soils with layers of partly or completely impermeable artificial material such as asphalt and concrete [23]. Increases in the extent of sealed land can be used to estimate land-use change for human use or intensification. The area of sealed soil in the EU has increased in all Member States since 2006. Between 2006 and 2018, the total EU area covered with impervious materials grew by 3 605 km2 or 3.4%. In 2018, the area of sealed soil surface reached 2.7% in the EU. Across Member States, the share of area covered with impervious materials ranged from below 1% in Sweden and Finland to around 10% in Belgium and the Netherlands up to 18% in Malta.
The EU might miss its target for municipal waste recycling as progress slows
The ‘waste hierarchy’ is the overarching logic that guides EU waste policy. It prioritises waste prevention, followed by preparing for reuse, recycling, other recovery and finally disposal, including landfilling, as the last resort. Waste management activities promote recycling, which reduces the amount of waste going to landfills and leads to higher resource efficiency. Although municipal waste accounts for less than 10% of the weight of total waste generated in the EU [24], it is highly visible and closely linked to consumption patterns. Sustainable management of this waste stream reduces the adverse environmental impact of cities and communities, which is why the EU has set a target to recycle or prepare for reuse at least 60% of its municipal waste by 2030 [25].
In 2023, the EU residents generated 229 129 thousand tonnes of municipal waste, corresponding to 511 kilograms (kg) of waste per capita per year [26]. Between 2018 and 2023, the annual amount of waste generated per capita grew by 11 kg, which represents an increase of 2.2%. Although the EU has not reduced its municipal waste generation, it has clearly shifted to more recycling. Since 2000, the recycling rate of municipal waste — covering both recycling and preparing for re-use — has increased from 27.3% to 48.2% in 2023. However, this positive trend halted in 2021, and the recycling rate dropped by 1.7 percentage points between 2021 and 2023. Over the short-term period from 2018 to 2023, the share of recycled municipal waste thus only increased by 1.8 percentage points. Stronger efforts are therefore needed to put the EU back on track to meet its 2030 recycling targets.
Uptake in the connection rate to wastewater treatment in the EU has slowed down
Urban areas also place significant pressure on the water environment through wastewater from households and industry that contains organic matter, nutrients and hazardous substances. The share of the EU population connected to at least secondary waste water treatment plants, which decompose most of the organic material and retain some of the nutrients, has been steadily growing since 2000 and reached 80.9% in 2022, although the pace has slowed. In six Member States, more than 90% of the population were connected to such services according to the most recent data (which refer to 2017, 2019, 2020, 2021 or 2022, depending on the country). However, it may not be suitable to connect 100% of the population to a sewage collection system, either because it would produce no environmental benefit or would be too costly (see article on SDG 6 ‘Clean water and sanitation’).
Main indicators
Severe housing deprivation rate

The severe housing deprivation rate is defined as the percentage of the population living in a dwelling which is considered to be overcrowded, while also exhibiting at least one of the following housing deprivation measures: i) a leaking roof, ii) no bath/shower and no indoor toilet, and iii) considered too dark. The data stem from the EU Statistics on Income and Living Conditions (EU-SILC).
.png)
Source: Eurostat (online data codes: (sdg_11_11) and (ilc_mdho06d))
.png)
Source: Eurostat (sdg_11_11)
Population living in households suffering from noise

This indicator measures the share of the population who declare they are affected either by noise from neighbours or from the street. Because the assessment of noise pollution is subjective, it should be noted that the indicator accounts for both the levels of noise pollution as well as what people consider to be acceptable. Therefore, an increase in the value of the indicator may not necessarily indicate a similar increase in noise pollution levels; it may also indicate a decrease in the levels that European citizens are willing to tolerate and vice versa. In fact, there is empirical evidence that perceived environmental quality by individuals is not always consistent with the actual environmental quality assessed using ‘objective’ indicators, particularly for noise. The data stem from the EU Statistics on Income and Living Conditions (EU-SILC).
.png)
Source: Eurostat (online data codes: (sdg_11_20) and (ilc_mddw04))
.png)
Source: Eurostat (sdg_11_20)
Premature deaths due to exposure to fine particulate matter (PM2.5)
_evaluation_2025.png)
The indicator measures the number of premature deaths due to exposure to particulate matter. Fine particulates (PM2.5) are particulates whose diameter is less than 2.5 micrometres, meaning they can be carried deep into the lungs where they can cause inflammation and exacerbate the condition of people already suffering from heart and lung diseases. Premature deaths refer to those deaths that occur before the expected age of death. This expected age is typically defined by accounting for the life expectancy in the country, stratified by sex and age. The data stem from the European Environment Agency.
,_EU,_2005-2022_(number).png)
Source: EEA, Eurostat (sdg_11_52)
,_by_country,_2017_and_2022_(number_per_100_000_people).png)
Source: EEA, Eurostat (sdg_11_52)
Road traffic deaths

This indicator measures the number of fatalities caused by road crashes, including drivers and passengers of motorised vehicles and pedal cycles, as well as pedestrians. People who die from road crashes up to 30 days after the crash occurred are counted as fatalities. The data come from the CARE database managed by DG Mobility and Transport (DG MOVE).
.png)
Source: European Commission services, DG Mobility and Transport, Eurostat (sdg_11_40)
.png)
Source: European Commission services, DG Mobility and Transport, Eurostat (sdg_11_40)
Soil sealing index

This indicator estimates the increase in sealed soil surfaces with impervious materials due to development and construction (such as buildings, constructions and laying of completely or partially impermeable artificial material, such as asphalt, metal, glass, plastic or concrete). This provides an indication of the rate of soil sealing, which occurs when there is a change in land use towards artificial and urban land use. The indicator builds on data from the Imperviousness High Resolution Layer (a product of the Copernicus Land Monitoring Service).
.png)
Note: y-axis does not start at 0.
Source: Eurostat (sdg_11_32)
.png)
Source: Eurostat (sdg_11_32)
Recycling rate of municipal waste

This indicator measures the tonnage recycled or prepared for re-use from municipal waste divided by the total municipal waste generated. Recycling includes material recycling, composting and anaerobic digestion. Municipal waste primarily consists of waste generated by households but it also includes similar types of waste generated by small businesses, offices and public institutions that are collected by or on behalf of municipalities. The specific composition of municipal waste can vary from municipality to municipality and from country to country, depending on the local waste management systems in place. For areas not covered by a municipal waste collection scheme the amount of waste generated is estimated.
.png)
Note: y-axis does not start at 0.
Source: Eurostat (sdg_11_60)
.png)
Source: Eurostat (sdg_11_60)
Footnotes
- ↑ 2023 data. Source: Eurostat (ilc_lvho01) and (demo_gind).
- ↑ Eurostat (2016), Urban Europe: Statistics on cities, towns and suburbs, Publications Office of the European Union, Luxembourg, p. 9.
- ↑ European Environment Agency (2019), Population exposure to environmental noise.
- ↑ It needs to be noted that the figures on noise disturbance presented here include noise from different sources than those covered by the Environmental Noise Directive.
- ↑ Berglund, B., Lindvall, T., Schwela, D.H. (1999), Guidelines for Community Noise, World Health Organization (WHO), Geneva.
- ↑ WHO (2021), WHO global air quality guidelines: particulate matter (PM2.5 and PM10), ozone, nitrogen dioxide, sulfur dioxide and carbon monoxide, World Health Organization; and European Environment Agency (2023), Harm to human health from air pollution in Europe: burden of disease 2023, Briefing no. 23/2023.
- ↑ For PM2.5, the Ambient Air Quality Directive 2008/50/EC introduced a target value to be attained by 2010, which became a limit value starting in 2015. For more information on EU air quality standards see: http://ec.europa.eu/environment/air/quality/standards.htm.
- ↑ European Environment Agency (2024), Europe’s air quality status 2024.
- ↑ Degree of urbanisation classifies local administrative units as ‘cities’, ‘towns and suburbs’ or ‘rural areas’. In ‘cities’ at least 50 % of the population lives in an urban centre. If less than 50% lives in an urban centre but more than 50% of the population lives in an urban cluster it is classified as ‘towns and suburbs’, and if more than 50% of the population lives outside an urban cluster it is classified as a ‘rural area’. An urban centre is a cluster of contiguous grid cells of 1 square kilometre (km2) with a density of at least 1 500 inhabitants per km2 and a minimum population of 50 000 people. An urban cluster is a cluster of contiguous grid cells of 1 km2 with a density of at least 300 inhabitants per km2 and a minimum population of 5 000 people.
- ↑ Source: Eurostat (ilc_mddw06).
- ↑ Source: Eurostat (ilc_mddw04).
- ↑ Source: Eurostat (online data code: (ilc_mdho06D)).
- ↑ Lozzi, G., Ramos, C., Cré, I. (2022), Research for TRAN Committee – Relaunching transport and tourism in the EU after COVID-19 – Part VI: Public Transport, European Parliament, Policy Department for Structural and Cohesion Policies, Brussels.
- ↑ Tram and metro systems, as well as active modes (walking, cycling), are not included because the data collection methodology for these means of transport is not sufficiently harmonised between Member States.
- ↑ Source: Eurostat (tran_hv_psmod).
- ↑ European Commission (2024), Facts & Figures: Serious injuries.
- ↑ Source: Eurostat (tran_sf_roadro).
- ↑ European Commission (2025), Annual statistical report on road safety in the EU 2025, p. 37.
- ↑ Source: Eurostat (tran_sf_roadus).
- ↑ European Commission (2025), Annual statistical report on road safety in the EU 2025, p. 15.
- ↑ UN-Habitat (2016), Urbanization and Development: Emerging Futures, World Cities report 2016, pp. 85–100.
- ↑ European Environment Agency (2023), 8th Environment Action Programme. Land Take: net land take in cities and commuting zones in Europe.
- ↑ Prokop G, Jobstmann H, Schonbauer A (2011), Report on best practices for limiting soil sealing and mitigating its effects, Brussels.
- ↑ Eurostat (2024), Statistics explained: Municipal waste statistics.
- ↑ European Commission (2018), Directive (EU) 2018/851 of the European Parliament and of the Council of 30 May 2018 amending Directive 2008/98/EC on waste (Text with EEA relevance).
- ↑ Source: Eurostat (env_wasmun)
Explore further
Other articles
Database
Thematic section
Publications
Further reading on sustainable cities and communities
- European Commission (2024), Road safety thematic report – Main factors causing fatal crashes, European Road Safety Observatory, Brussels.
- EEA (2025), Air quality status report 2025.
- EEA (2024), Urban adaptation in Europe: what works? Implementing climate action in European cities.
- Eurostat (2024), Eurostat regional yearbook 2024, Publications Office of the European Union, Luxembourg.
- Joint Research Centre (2024), Atlas of the Human Planet 2024, Publications Office of the European Union, Luxembourg.
- The Housing Europe (2023), The State of Housing in Europe 2023, Housing Europe, the European Federation for Public, Cooperative and Social Housing, Brussels.
- UN-Habitat (2024), World Cities Report 2024: Cities and Climate Action.
- WHO (2023), Global Status Report on Road Safety 2023.
- WHO (2019), Environmental Noise Guidelines for the European Region, WHO Regional Office for Europe, Copenhagen.
Methodology
More detailed information on EU SDG indicators for monitoring of progress towards the UN Sustainable Development Goals (SDGs), such as indicator relevance, definitions, methodological notes, background and potential linkages can be found in the introduction as well as in Annex II of the publication ’Sustainable development in the European Union — Monitoring report on progress towards the SDGs in an EU context — 2025 edition’.
External links
Further data sources on sustainable cities and communities
- EEA, Air pollution.
- EEA, Land take.
- EEA, Noise.
- EEA, Waste recycling.
- European Commission, European Road Safety Observatory – Data and analysis.
- European Commission, Urban Data Platform.