No higher resolution available.
Distribution_of_population_by_tenure_status,_2007_(%).PNG (608 × 239 pixels, file size: 30 KB, MIME type: image/png )
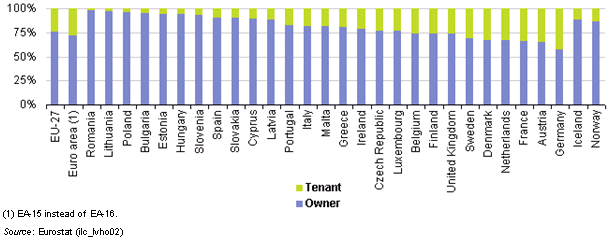
Distribution of population by tenure status, 2007
- (%)
Graph created with data from September 2009
Most recent data available now, see:
Distribution of population by tenure status, type of household and income group (ilc_lvho02)
File usage
There are no pages that use this file.
.PNG&oldid=23964)